
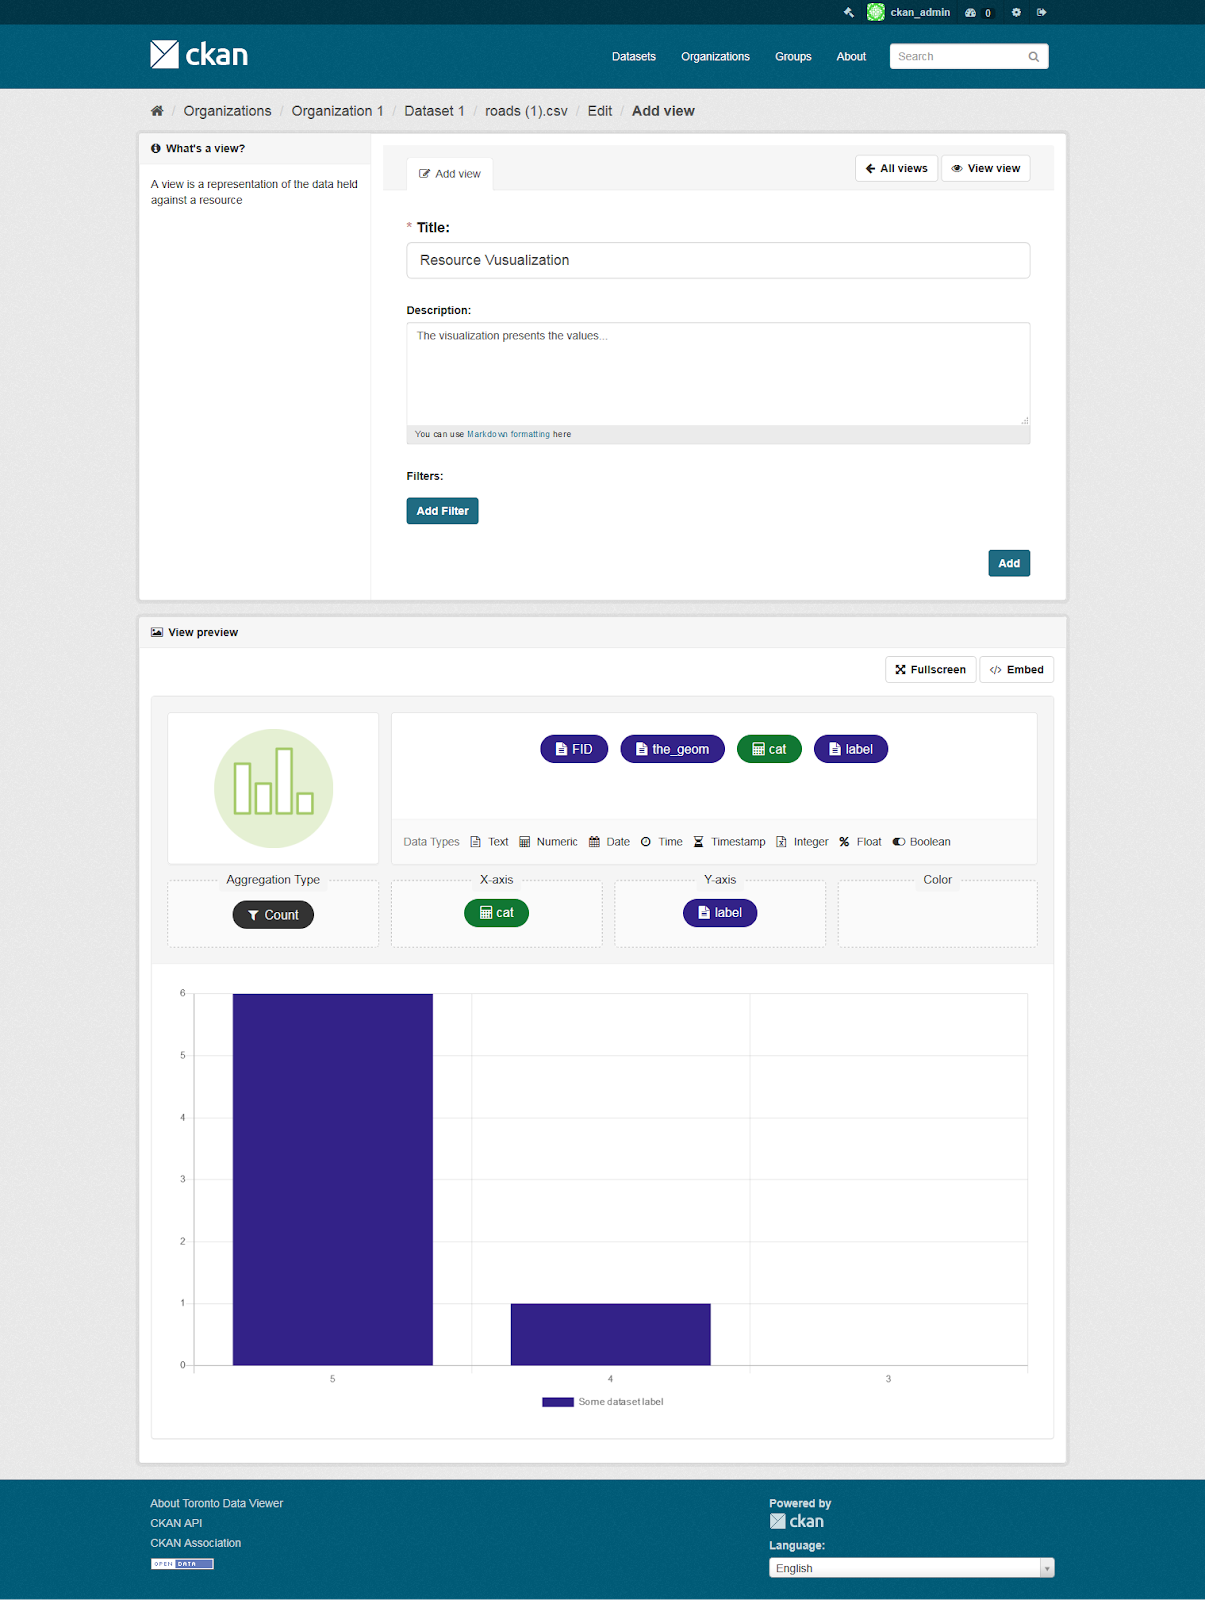
If you want to help your Data Portal users to visualize data in a very efficient and intuitive way, through a simple to use User Interface, you can do it easily with ckanext-visualize.
With this data viewer, users don’t need any technical knowledge or data literacy to visualize the data. The viewer automatically creates the most meaningful chart based on the chosen columns.
Additionally, the administrators of the portal are able to create predefined charts and easily configure them based on the needs.
The extension is optimized to work across many screen sizes, from mobile to desktop, enabling citizens to use the data viewer anywhere, anytime, on any device they have.
What does the extension offer
- Intuitive and easy to use. This CKAN extension enables users to easily build and visualize charts that are simple to use.
- Predefined charts. Administrators can create meaningful charts for users as CKAN views, so they can immediately visualize and understand the data.
- Standalone chart viewer. The extension allows the chart viewer to be embedded on third-party websites without creating CKAN views.
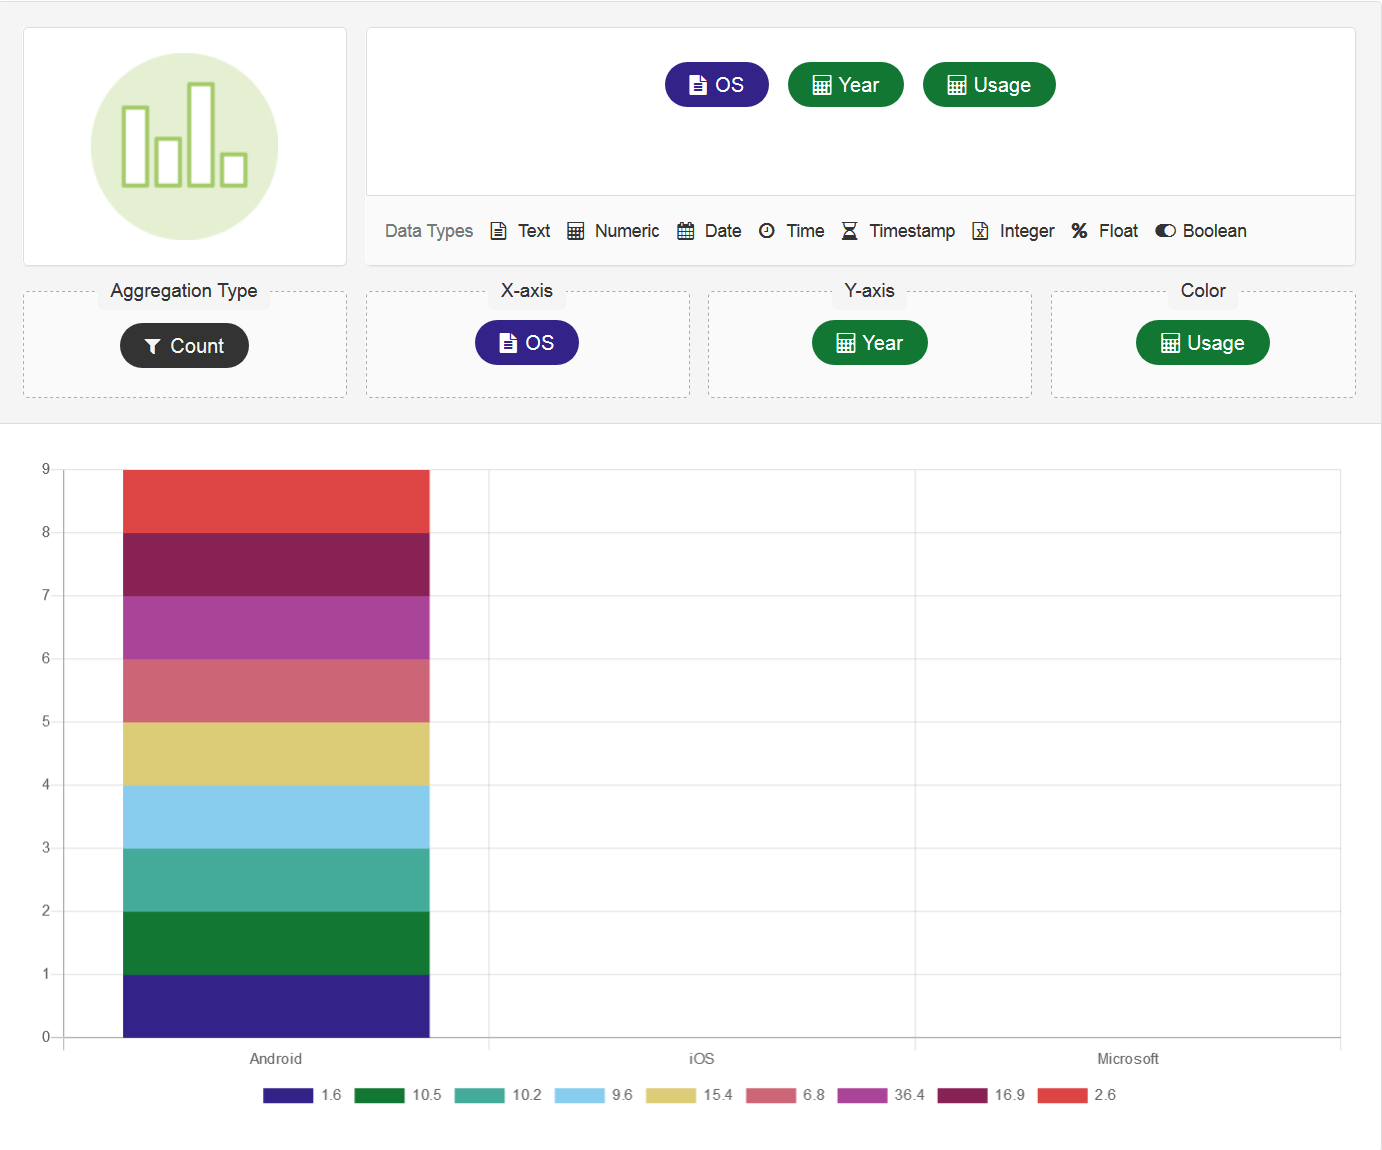
- Intelligent chart type selection. Depending on the data types of the columns that are chosen, the extension automatically chooses the most appropriate type to visualize the data.

- Drag-and-drop columns. Creating a chart is as easy as dragging a column from the list of all available columns into the X or Y axis.
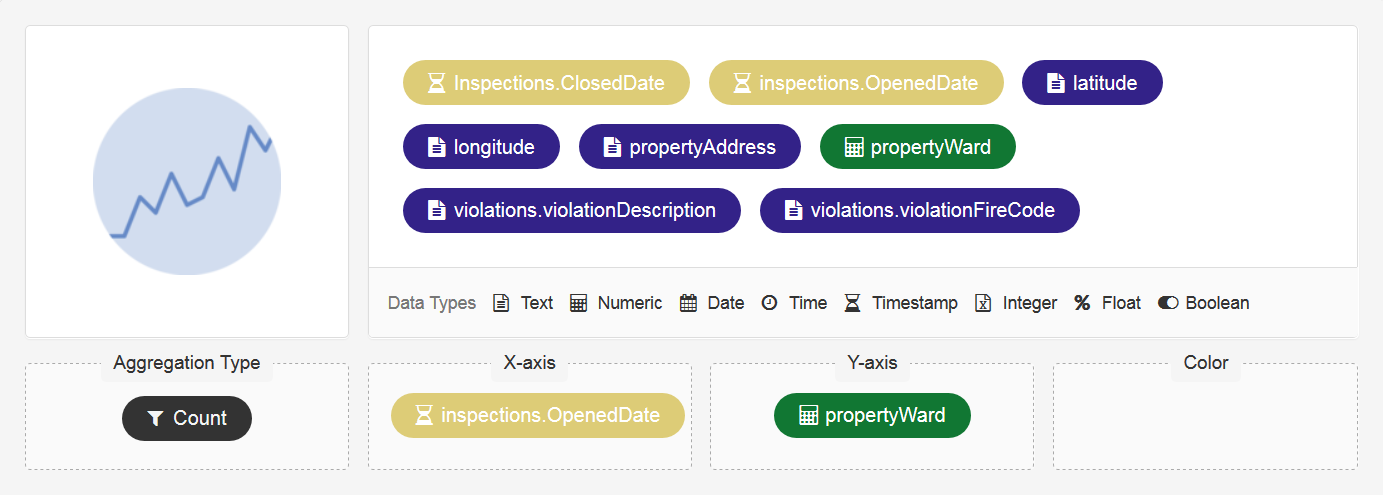
- Color attribute. Data in the chart can be grouped based on the selected column and colored for each distinct value.
- Visually distinct columns. All available columns that can be dragged are color coded based on the data type of the column and have a specific icon defined in a legend.
- Chart types. The viewer supports the following types of chart: bar, line and point, with more coming in the next release.

- Customizable color palette. The extension comes with a default color palette that is using carefully chosen colors that are accessible, with the possibility to change them and add additional ones from a configuration page.

- Customizable chart type icons. For each supported chart type, there is a corresponding icon that can be customized from a configuration page.
- Mobile support. Drag-and-drop functionality is supported on mobile devices as well.
Responsive. The extension is optimized to work across many screen sizes, from mobile to desktop
How to install it
To install ckanext-visualize:
-
Activate your CKAN virtual environment, for example:
. /usr/lib/ckan/default/bin/activate -
Install the ckanext-visualize Python package into your virtual environment:
pip install ckanext-visualize -
Add
visualizeto theckan.pluginssetting in your CKAN config file (by default the config file is located at/etc/ckan/default/production.ini). -
Restart CKAN. For example if you’ve deployed CKAN with Apache on Ubuntu:
sudo service apache2 reload
Development Installation
To install ckanext-visualize for development, activate your CKAN virtualenv and do:
git clone https://github.com/keitaroinc/ckanext-visualize.git
cd ckanext-visualize
python setup.py develop
pip install -r requirements.txt
pip install -r dev-requirements.txt
Running the Tests
To run the tests, do:
pytest --ckan-ini=test.ini
To run the tests and produce a coverage report, first make sure you have pytest-cov installed in your virtualenv (pip install pytest-cov) then run:
pytest --ckan-ini=test.ini --cov=ckanext.visualize


